
 Inspired by the recent release of the cM Explainer at MyHeritage, Blaine Bettinger and I embarked on a comparison of relationship predictors. These are handy tools that indicate which relationships are most likely for our autosomal DNA matches. Each of the testing companies makes relationship suggestions; predictor tools take this one step further by assigning mathematical probabilities to the possibilities.
Three of these tools make predictions based only on the total amount of shared DNA (in centimorgans): DNA Painter’s original and beta versions of the Shared cM Tooland the built-in predictions at AncestryDNA. In fact, all three of these use data generated by scientists at Ancestry.com. We expect Ancestry’s predictions to have improved over time. The question is, how much? Answering that is one goal of the study and will be addressed in a future post.
 MyHeritage has taken a novel approach by including ages in their calculations. For example, other tools will report that a match of 3,500 cM could be a parent or a child but don’t tell you which. The cM Explainer can consider which match is older to distinguish between the two.
A parent/child match is a trivial example, of course, because we intuitively consider age in that case, perhaps without even realizing it. For other relationships, though, age can tip the scales in more subtle ways.This is why the cM Explainer holds such promise.
As one part of the study, we are comparing MyHeritage’s predictions (1) based on shared centimorgans alone with those (2) using both shared DNA and ages. We want to know whether using ages improves the predictions and, if so, by how much.
Preliminary Methods and Results
For the past several weeks, Blaine and I have been soliciting contributions to the study from the community. Volunteers can use their known DNA matches to test the prediction tools and report the results in this online survey. The entries feed directly into a Google Sheet that automatically calculates how frequently the correct relationship was the top prediction and other parameters. The calculations are done for specific relationships (e.g., first cousin, second cousin, etc.) as well as for centimorgan ranges.
Periodically, the data is screened for entry errors. The most common errors so far are numerical typos and mistakes in selecting a relationship from the pulldown menus in the survey. Errors are fixed whenever possible; if not, we remove the entry from the study.
During routine screening, we discovered that MyHeritage tweaked their probabilities on or around April 1. This was demoralizing, because it meant that the data collected up to that point could not be used. On the other hand, the changes to cM Explainer anecdotally look like improvements. And the response from our fabulous volunteers was overwhelming! With their help, we updated as many entries as possible and removed the others from analysis.
At the moment, the MyHeritage tool has 765 entries with ages and 2,748 without.
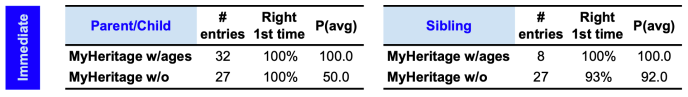
Including ages in the predictions works extremely well for immediate family. Without ages, the tool can only give a parent-child match a 50% chance of being a parent and a 50% chance of being a child. In other words, it’s always accurate (we resolve ties in favor of the tool) but with only 50% confidence. However, when we use ages, it gets the right relationship every time with 100% confidence.
Similarly, the cM Explainer gets full siblings right 100% of the time with 100% confidence when it knows the ages, but it averages only 92% certainty when it doesn’t know the ages. (Note that we only have 8 entries with ages for full siblings at the moment; the results may change with more data.)
We also see striking improvements for the “Group 2” relationships (as defined by the Shared cM Project). Without ages, cM Explainer never predicts grandparent–grandchild or half-sibling relationships as the most likely but can do so correctly at least 60% of the the time when given ages. It also has roughly four times more confidence in the predictions. With niblings (aunt/uncle–niece/nephew), the top prediction is usually correct either way, but the strength of the predictions is much higher when ages are used.

For Group 3 and Group 4 relationships, using ages doesn’t increase the right-the-first-time accuracy for first cousins (1C) or first cousins once removed (1C1R), although it improves the confidence of the predictions substantially. For grandniblings, half niblings, and half first cousins (h1C), the tool only gave the right relationship top billing when ages were used.

With Group 7 and Group 8 relationships, using ages improves accuracy and confidence, but to a lesser degree.

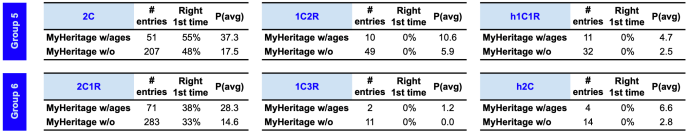
When we consider Group 5 and Group 6 relationships, using ages has only a marginal effect on accuracy, although it still increases confidence roughly two-fold.
Finally, for Group 7 and Group 8 relationships, using ages may be throwing the predictions off. For both fourth cousins (4C) and fourth cousins once removed (4C1R), cM Explainer was more likely to get the right answer the first time if it didn’t consider ages than if it did. Confidence was similar either way.

One possible explanation is that the computer model underlying the predictions could be making incorrect assumptions about family dynamics generations ago. For example, couples in the past often had much larger families than today, and the eldest child could easily be two decades older than the youngest. That means their modern-day descendants could be in the same generation but have very different ages, or vice versa. Either eventuality could mislead age-based predictions.
You Can Help!
We are still collecting data! If you’d like to help, you can use your known DNA matches to test the prediction tools and report the results in this online survey. It will prompt you to evaluate the same match in different tools. To get started, you’ll want to have handy: the known relationship, the amount of shared DNA in centimorgans, the number of segments, and (if possible) the age of the DNA match. You can submit as many matches as you like by going through the survey multiple times. We even have a spreadsheet entry form for power contributors.
Thanks to the volumes of data already collected, we’ve been able to streamline the survey, so it’s faster and easier than ever to help out!

At the moment, we most need reports from MyHeritage’s cM Explainer using ages (all centimorgan amounts) as well as from AncestryDNA for matches who share between 1,000 and 3,000 cM. The latter predictions are only available to people who tested directly at Ancestry.
I can’t emphasize enough how amazing this genealogy community is! Your contributions will help improve relationship prediction tools for all of us.

Posts in This Series
- Relationship Prediction Tools: Which Is Best?
- The Relationship Predictor Comparison: A First Peek
- In Which Citizen Science Finds an Error, and the Error Is Fixed
- The Science Behind Relationship Predictors
Your evaluation letter (April 11) makes this an exciting project! I have several more entries I can offer. Is there a need for close relationships? Medium? distant? I have a few of each and want to provide whatever is most useful.
We’ll take anything you can offer!
One of the main MyHeritage talking points about cM Explainer is that it has vastly improved on predicting relationships for folks who come from endogamous groups- For these groups, on average, they have historically significantly overstated relationship closeness. Your right up not only makes no mention of this but it seems, based on how you have presented your data, that you are not considering this. Also, I looked at your survey and it does not seem to ask about this.
But maybe I’m getting something wrong -Please explain
(Also, it seems you aren’t looking at how well it approximates the relationship -Only at whether it nails it )
They had not announced the Ashkenazi adjustments when this study was initiated, so it was not included in the design. (They are not adjusting for other endogamous groups yet, just Ashkenazim.)
The survey considers whether the correct relationship was predicted first, second, or third; what what its probability was; and whether it was not predicted at all. I chose not to include the second/third place data in the write-up because it was encompassed in the average probability. I can include it in a future update if the community thinks it is valuable.
Do you think it is worth including relationship probabilities in a genealogy article showing relationships out to the 6th cousin level among DNA testers? Or what would be the limit in the ability to differentiate relationships–4th cousin?
Personally, I am dubious that relationships past about 4C can be distinguished using one-to-one atDNA matches. By that point, you’re dealing with single-segment matches less than 20 cM, and that will look about the same whether it’s a 5th cousin or a 10th one.
For distant matches, there is potential in using multiple testers, though. For example, if 100 descendants of your 4th great grandparent have tested, you might be able to assign a probability to a potential 5th cousin based on how many of the 4GGP descendants they match and the cM distribution. This would require a robust tree and access to a lot of kits, but I’m kinda excited about the idea.
We have a research project that includes 100s of documented descendants of an ancestral couple. If you’re interested, I can make this data available to you.
If you’re willing to submit the match data to the survey, that would be fabulous!
Thanks for sharing that the survey is still open! It helps to know what type of data is needed most. You guys are awesome. @ancestrywithtaylor
Yes, the survey is still open! The link is in the post. The last section of the post also outlines some of the data we need most. Thank you!
I made mistakes on my entries. Preferably, I’d like to correct them but don’t see a way to do that. Otherwise, I’d like to delete them and start clean, but don’t see a way to do that either.
I will email you a list of your entries. Just let me know what the corrections are.
I agree! I am working to publish those kind of results in a piece with an interesting chart that shows how the shared cM and segments declines in moving out from 1st to 6th cousins who all share matches, and probably parts of one segment, in common.
I’ll look forward to that!
Where can the spreadsheet form be found as I consider myself a power user and would like to contribute to this project?
Thanks so much! I’ll send you an email with the link and guidelines.
I’ll be doing an insider’s peek at the data collection, quality control, and analysis on Friday, April 21 at 2 PM PDT. You can sign up here if you’re interested: https://www.eventbrite.com/e/618241124847
Leah
Great article ..my grandson’s match with me is 17.13 % and 33 segments and my 2 grandaughters are about 23+% with 20 segments.. This grandson has a mixed paternal heritage..is that why? I sent it to you but maybe after the date you needed.
I now have a V5 AncestryDNA kit ( they gave me a discount) because they call him my great Grandson which he was not.
I was present and awake at both births, daughter and Grandson.
Your match to your grandson is probably just normal variation. Your grandson just happened to get more of your partner’s DNA than yours.