
It’s happened again, folks! Another company has updated their ethnicity estimates, and people are all aflutter. They replaced my German with Sweden & Denmark! Why can’t they give me better estimates from Africa? Mine are 100% accurate! It’s all a scam!
So why are ethnicity estimates so hit-or-miss? Why do different companies give you different estimates? And which company is best?

Last Question First
I’ll address some of the science nitty gritty below, but let’s cut to the chase: Which test is best for ethnicity? To answer that, we need to know what the “right” answer is, and we need an objective way of comparing estimates from different companies.
If your tree is reasonably well documented out to 2nd or 3rd great grandparents (or further) and you know where those ancestors were from, you can easily calculate a “score” to compare your ethnicity estimates at different companies.
In my case, I noted the origins of each of my 32 great-great-great grandparents. On my father’s side, all were either immigrants themselves or the children of immigrants, so their origins were straightforward. Most of my mother’s ancestors have been in Louisiana since before the Revolutionary War and are mixes of Acadian French, other French, Spanish, and Irish.

I used this information to estimate that I am roughly 38% French (including Acadian), 34% German, 17% Irish, 6% Spanish, 2% English, and 3% unknown (probably French or English). These are my “expected” percentages.
How does that stack up to the company estimates? Here’s a simple scoring system:
- First, treat each percentage as a regular number, so 38% becomes 38, not 0.38.
- Next, for each of your known ethnicities, subtract your company estimate from your expected percentage. For example, AncestryDNA currently estimates me at 42% French when I expected 38%. That’s a difference of 42 – 38 = 4. Some values will be negative; don’t worry about that.
- Third, square your differences. In my case, 42 is 16. I do the same for each ethnicity. (Squaring the values is a trick borrowed from curve-fitting in statistics. It increases the penalty on estimates that are further off the mark.)
- Finally, sum up all the squared values.
This gives you a “score” for each ethnicity estimate from each company. Here are my scores for four different companies. Lower scores are better, like golf.
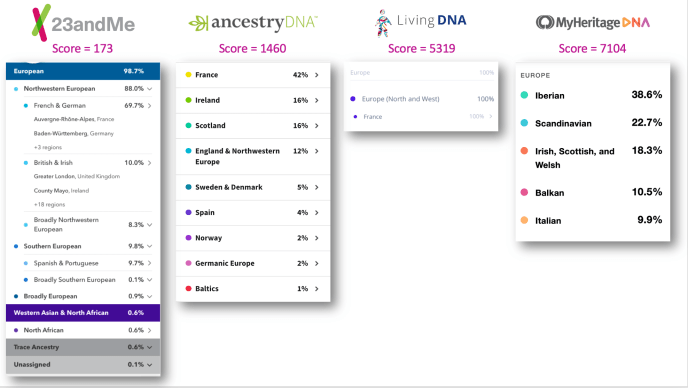
By this metric, 23andMe gives me the best ethnicity estimates, with a score of 173. The recent update from AncestryDNA was next, scoring 1,460. Living DNA and MyHeritage trailed quite a bit, at 5,319 and 7,104, respectively.
I’ve been tracking my ethnicity estimates since I first tested. The trends are interesting. 23andMe has gotten better for me with every update, from an initial score of 2,459 to 173 now. AncestryDNA, on the other hand, has been all over the board, starting at 5,594 and reaching a low of 70 before veering upward again. That score, from 2018, was the best ethnicity estimate I’ve had from any company. Living DNA was getting progressively better (dropping from 4,195 to 519) until this latest update, which puts me at 100% French. That is biologically impossible, given that my father is German and Irish.

What works for me might not work for you, though. I encourage you to calculate your own scores and post the results in the comments. Comparing which companies work best for which ethnicities is a valuable exercise. That information will be especially helpful for those with unnknowns in their trees, like adoptees, people with unknown grandfathers, and so on.
The Science Behind Ethnicity
Our ethnicity results change with updates and vary among testing companies because ethnicity estimates are hard. Much like the Babylonians estimated the value of π (pi) as 3, and mathematicians in Egypt, China, India, and Europe refined that value over the centuries, ethnicity estimates improve (or not) at variable rates depending on the company and its methods.
Ethnicity estimates are a lot harder than π. After all, there’s only one π, but we each get our own ethnicity estimates drawn from thousands of genetically distinct ethnic groups around the world. And π doesn’t change. The true value of π was the same 1,000 years ago as it is today, while the genetic makeup of, say, someone in the Levant in 1500 CE wasn’t the same as a living Palestinian.

That brings up another challenge: ethnicity estimates reflect your ancestors from about 500–1000 years ago, but the companies are using modern-day people as their reference points. After all, they don’t have a TARDIS to travel back in time to ask our ancestors to spit in a tube.
Those modern-day individuals make up what’s called a reference panel or reference dataset. They are carefully chosen to have ancestors who lived in the same area for generations, under the assumption that those living individuals reflect the genetics of the area 500–1000 years ago. Your DNA is compared to that reference panel to get your ethnicity estimates.
The companies all draw from some publicly available datasets like the1000 Genomes Project. They then supplement that public data with their own proprietary samples. Accuracy depends on how many reference individuals a company has and how many regions of the world they represent. That’s one reason you are likely to get different estimates from each company, even though you are always you.
The table below compares the reference panels for the five biggest genealogy databases, as of 2021.

To generate your ethnicity estimate, a company look at each bit of DNA in your sample, compares it to each of their reference populations, and estimates the likelihood that your bit came from that population. They do that for each of ≈700,000 bits of DNA (called SNPs, or snips) then calculate percentages based on how much of your genome falls into each population.
23andMe will even show you a “chromosome painting” of which regions are assigned to each part of your chromosomes.

Of course, the reference populations can be quite similar to one another. For example, France and Germany have been at the crossroads of Europe for centuries, so it’s not surprising that their populations have incorporated genetic diversity from southern, northern, and eastern Europe. That can make some areas harder to distinguish than others. And if your parents were French and German, respectively, like mine, it can be especially hard for the algorithms to tell them apart in you.
You Are Not (Quite) Who You Think You Are
You inherit exactly half of your autosomal DNA from each parent, but you don’t inherit equal amounts of atDNA from each grandparent, great grandparent, etc. The way DNA is divvied up during reproduction is too random for such precision.
As a result, you might genuinely have a Korean great grandmother but not 12.5% Korean DNA. That randomness is built in to the biology; there’s nothing the testing companies can do about it. It doesn’t mean the testing company got it wrong if they only estimate 7%, or that your great grandmother wasn’t fully Korean.
This variability gets worse with each generation back. There’s a small chance you won’t inherit any DNA at all from a specific 5th great grandparent, and the chances of that happening for any given ancestor increase with each generation.This is the difference between a genealogical ancestor (in your tree) and genetic ancestor (in your DNA).
As you can see, there are many reasons ethnicity estimates aren’t as exact as we’d like them to be. It’s a developing science, and I personally appreciate the ongoing efforts the companies put into it.

Thank Leah for basically confirming what I have estimated also with my own German & Italian ethnicity. I do have a rather extensive write-up with screenshots of the big 4 companies (including FTDNA but excluding LivingDNA) here: https://help.yourdna.family/hc/en-us/articles/360004214496-What-DNA-testing-company-offers-the-most-accurate-detailed-ethnicity-prediction-if-you-have-German-ancestry-
Unfortunately I’m missing FTDNA in your comparison, you haven’t tested with them?
They score worst for me, with a ghost ethnicity showing up for myself which both my parents don’t even have (how strange is that?).
So I’d be interested to hear your view where you see FTDNA’s most recent Origins 3.0 update vs the other 4.
Thanks!
I deleted my kit from FTDNA after they violated their ToS. The most recent MyOrigins report I had for them was from 2017. I think that was v2. It scored 7406. I don’t have a score for their v3, obviously.
Interesting. I am going to try to do this but my estimates will be more speculative than yours. Almost all of my lines were in the US by about 1620 to 1740 and I can’t document their countries of origin, in many cases.
I’d love to see what you find. Most of my Acadians were in North America by the mid-1600s, but their origins were pretty clearly French.
My problem too
Great post, many thanks. One thing I remember reading was that different companies take a snapshot of your ethnicity from different points in time, like one might be 2000 years ago, and another might be 5000 years ago. Is this valid and does it impact on the outcomes?
23andMe, AncestryDNA, and FTDNA all describe pretty much the same methods, so it’s safe to assume they’re estimating the same timeframes. Neither MyHeritage nor Living DNA has explained their methods to my knowledge, but I’m pretty sure they’re using the same protocols and would also be estimating in the 500–1000 year range.
I am 76% British Isles, 16% German, 7% Dutch and 1% Spanish. FTDNA is the only one that picked up the Iberian. 23andMe matched exactly on British/Irish. Ancestry lumps England in with NW Europe, and I can’t separate my British Isles into separate countries to get the English out.
I guess my problem is in having so many early immigrants that I can’t get them back to specific parts of the British Isles…
I can’t identify any Scandinavians, but my percentages there range from .7 to 9.5 to 33. I think they’re all in my Brits.
What do I do with the companies estimates for countries that are not in my tree? For instance My Heritage Give me 11.3% Italian and 3.8% Iberian along with the 55.9% English, Scottish & Welsh, N & W Europe 29%
It’s a bit different than the others I’m uploaded to:
Living DNA: 100% Great Britain & Ireland
FTDNA: 71% England, Wales & Scotland, Ireland 24%, Greece & Balkans 4%, Baltic <1%
Ancestry: 64% Scotland 20% England Ireland 6% Wales 5% Norway 4% N India 1%
My estimates from my 3xGGPS are: 48% Scotland, 42% England, 6% Ireland, 1% India (Greek father), 1% India (English father mother unknown but I suspect Indian).
I think the Living DNA is a brilliant break down of the regions in the UK and given me food for thought on where more distant ancestors came from. Ancestry I always thought was accurate until they upped my Scottish % this time as my mother is the Scottish side and my father the English, Irish and Greek side. FTDNA I've never liked using their search and not found it useful but they have got it pretty much spot on!
Treat the suspect regions just like the others. MyHeritage estimates 11% and your expected is zero. Subtract 0 – 11 to get -11 and square that to get 121. Then add up all the individual scores for each ethnicity. (Squaring has the nice effect of both penalizing estimates that are further off and making the negative values positive again.)
Thank you. My results appear to be around the other way. The one with lowest result (My Heritage) seems to be the one the furthest out. Living DNA the highest result (it hasn’t been updated since Feb 2020) although their breakdown of my 100% Great Britain and Ireland into eleven regions is very accurate bar two of them!
Agree with Leah here. Not sure who writes such time periods but it would mean that they concentrate on much smaller segment size that the usual 7cM (or 8 cM as with Ancestry now).
I don’t see that with any DNA testing company as it’s common knowledge that the smaller your minimum threshold the further back the origin (common ancestor) for that DNA segment is
Ethnicity estimates are done SNP-by-SNP rather than with segments. The Genetic Communities at Ancestry, the Genetic Groups at MyHeritage, and Regions at 23andMe are all based on segment matching. Those give a more recent picture but don’t come with percentages.
FTDNA does chromosome painting by region.
So here’s mine:
Using my 3X great grandparents, all of whose ethnicities are generally known, I should have 34% English, 28% German, 16% Scottish, 13% Irish and 9% Dutch. My English ancestry was all in the US since before the Revolutionary War. Five of my German 3X grandparents and all my Dutch ancestors were still in their home countries, as were two of my Scottish 3X great grandparents.
My scores:
Ancestry: 1109. Their map includes the Netherlands in the English circle, so if that accounts for my Dutch ancestry, the score would be 946.
Living: 1781. They correctly identified the areas of Germany my ancestry came from. They didn’t identify the Dutch and they gave me a big score for Wales and, to my knowledge, I have no Welsh ancestry. Living was the most accurate in terms of placing my ancestry in the areas of England, Scotland and Germany that I know they came from. It’s just their percentages were off.
My Heritage: 1522 They were spot on with the English and Scottish but gave me 38% Scandinavian. Because my German ancestry is in the north, including Schleswig-Holstein, it is possible I have Danish ancestry way back, but the German score they gave took up most of my known German. They also gave me a few percent Greek and Italian ethnicity!
23andMe: 937 They also correctly identified the areas of Germany where my ancestry came from but seem to have attributed much of the ancestry to Scandinavia again. The identified no Scottish ethnicity at all but gave me much more Irish. This may be a misreading of Scots-Irish, as a couple of my lines went from Scotland to Ireland before coming to the US. While their score is the lowest, their breakdown is one of the least useful in terms of matching my known ancestry.
Thanks for sharing your numbers!
Have you tried comparing/using the 23andMe Ancestry Composition in conjunction with DNA Painter to identify which ancestral lines come from where? I’m still trying to track down the source of my considerable Scandinavian reading, which ranged from 13% to 38% depending on the site. Comparing 23andMe’s Ancestry Composition with my DNA Painter painted chromosome map, intriguingly the Scandinavian does not fall on the same chromosomes as my German ancestry, but I see there is now much more I can do over at DNA Painter to refine my map. Just curious if I’m on a hiding to nowhere using 23andMe’s breakdown.
I haven’t tried that in quite a while, to be honest! I guess I know what I’m doing this weekend!
Yes, the are based on the actual allele value but no company can predict an ethnicity by a single SNP only. They use the unique haplotypes to predict ethnicity hence these are segments.
At least for 23andMe (which has the highest accuracy and the most detailed results) they use relatively large segments as everyone who has an account with them can check for him/herself.
It’s larger than the segment size for triangulated groups which means that when two ancestors are from the same small region then they are identified as one (which makes sense).
But it’s the opposite of a single allele value as it has very little predictable power towards anything (ethnicity or illnesses with very few exceptions).
That’s a good point. The companies are estimating ethnicity by subdividing the genome into what they call “windows”. Within each window, they’re analyzing the probability that that set of SNPs came from a given population (rather than matching segments). Finally, then they compare adjacent windows looking for anomalies. Ancestry uses 1001 windows for an average of ≈3.5 cM per window. 23andMe’s windows are ≈300 SNPs, which works out to ≈1.7 cM each. At FTDNA, it looks like the windows are about 3.8 cM. T
I should add that all of the white papers say that they’re statistically phasing the chromosomes before they do the population estimates. 23andMe will also do parent-child phasing if both have tested there.
Although my sister & I are proven multiple times to share ancestry back to our 3x greats, our DNA origins (I prefer to avoid the e-word) have always been very different. All in, we share about 70% of our parental DNA but the 30% we don’t share seems to provide different results. On the DNA origins metric, we don’t look like siblings at all. We have a few uncertainties regarding a couple of our 3x greats who had children in England (so English assumed; one was a foundling) our expected results should be plus/minus 91% English, 6% Irish & 3% Welsh.
Ancestry currently scores 944 for me (64% English, 9% Irish, 12% Welsh, 10% Scottish & 5% Nordic (I have lumped Norway, Sweden & Denmark together for this exercise)). For my sister, the score is 1774 (57% English, 2% Irish, 7% Welsh, 19% Scottish & 14% Nordic).
I have identified some deep Nordic segments using my DNA Mapper projects to MyHeritage testers from Scandinavia (seems to be popular with those countries) as I have for some pre-1800’s Irish segments, so I know I/we have inherited some. The Nordic DNA must be from pre-late 1700’s and probably much earlier as must some of the European modelling (I have likely Huguenot ancestors from the C16th/C17th based on surnames).
MyHeritage in its general “England+” provides me with a score of only 4 (93% English, 7% Irish) so very close to my expectation from 3x greats. My sister scores 814 because of the additional categories not expected. She is 78% generally British Isles, but also 18% N&W European, 2% Eastern Europe, 1% Ashkenazi and 1% West Asian.
FTDNA v3 scores 3278 for me (43% English, Welsh, Scottish; 22% Irish, 9% Iberia, 12% Central Europe & 14% Nordic).
I am sure this reflects the complicated immigration history of the British Isles in general and the modelling used. I am intrigued by possible explanations based on my 40+ years of research but don’t take it too seriously. It would be nice if the testing companies indicated which categories certain segments fall into. Like the hidden segment data in Ancestry, so much useful information is not being made available.
Thanks for sharing your scores. The differences across companies, and even within a company for you versus your sister, are remarkable.
You already had me, years ago, but I usually don’t share my thoughts. Now the German/Danish “controversy” caught my attention, since this is going to affect my ethnicity estimates on whichever site this is that updated.
You see, I have two Danish ancestors who immigrated to Louisiana around 1830 something. (I would have to look up the records again but the exact year isn’t the point).
But wait one of them was from Schleswig, isn’t that part of Germany? It is now, but it was Denmark when they immigrated. That changed in the 2nd Schleswig War. So, what is my DNA supposed to show?
My Louisiana “French” heritage from the original fort at Natchitoches is muddled with a “Des Allemands” wife, meaning from Germany, but her father was actually of the surname Dubs from Switzerland and they changed it to Toups when they got to Louisiana to blend in better with the French.
My point is that DNA and geopolitical boundaries have no direct relevance to each other. They correlate well in some cases but in most cases there is a great deal of nuance to be considered. Expectations of DNA telling researchers where their ancestors lived immediately prior to boarding the ship to Eliis Island could benfit by better information.
You make an outstanding point. The companies tend to call the population regions by modern-day country names, most of which either didn’t exist at the time our DNA was percolating there or had very different borders.
As an aside, I had no idea Toups was originally Dubs. Thanks for enlightening me!
I think the amount of time, effort and angst devoted to ethnicity estimates is unfortunate, given their inherent (pun intended) lack of precision. If you already know your ancestral origins, it just becomes the described exercise of estimating their accuracy. If not, it doesn’t necessarily tell you much that’s useful in a research context (I realize there are special cases for, e.g. adoptees, where it can be very useful, but they seem to be just that, special cases).
I know that my ancestors were primarily Welsh and German, with a smattering of other points of origin (Ireland, Switzerland). I can’t get too concerned about the percentage of Sub-Saharan African, or Iberian Peninsula that an ethnicity estimate might report.
Far more interesting to me was learning that my yDNA haplogroup was among the 10% or so of those of Welsh ancestry who classify as, rather than Celtic, “Scandinavian/Teutonic”, which I optimistically interpret to mean Vikings. Now there’s an interesting result.
From a geeky scientist perspective, I find ethnicity estimates so interesting. Yes, they’re still inherently imprecise, but so is all science in its early phases. We figure stuff out, we make mistakes, we improve. That’s why it’s so much fun!
I agree about your yDNA haplogroup … fascinating!
I went back to see what Blaine Bettinger had to say about ethnicity estimates – most of the chapter is a review of how the companies do them, how they differ, etc. then right at the end is a little gem where he suggests that if you can see the DNA assigned to the various ethnic groups in a chromosome browser, and can match any of those segments to otherwise-unknown matches, you can gain some insight into which ancestral family may include the common ancestor, even if you don’t know exactly who the ancestor is. That’s fairly cool.
Thanks Dr Larkin
This article was very insightful. I will certainly try out calculating my expected ethnicity percentages and the “score” for two DNA companies. It was interesting to learn that the ethnicity estimates are actually being done by using a “modern/current” population; I thought ancient DNA was being used as reference.
Good article.
There are two universals for Ethnicity estimates.
1)You trust your own more as your input increases and your tree builds.
2)The further back you go on all lines, the more accurate your own estimate becomes.
Regarding company estimates none of the big guys have a Cornish panel, and I have quite a large Cornish ancestry. Ancestry uses DNA to find a Cornish community for me which is quite a good estimate. Nominally that Cornish is included in English and NW European. This time that is probably partly true, but some Cornish is included as Scottish – but previously it’s nearly all been called Irish.
My Wends/Sorbs are another group without a panel. In various tests they come up as similar to Croats and here as other Slavs. I still have not untangled my own lines. My father’s part of what is now Poland was a mix of East and West German and several kinds of Slavs: some local for some time, some newly arrived and so mixed to different degrees. Therefore some still spoke a Slavic language and some had taken to the local German dialect. I can’t yet distinguish Silesian Slavs from Wielkopolski from Pomorskie or from NE Baltic coast, but some surnames leave tantalising clues.
So I don’t expect any DNA company to unravel that lot accurately.
But with a few more panels maybe their hints will improve.
It’s even cooler that this is an automatic feature in my “Your DNA family” app.
One of the main reasons why we started to work with 23andMe is that they provide you with a file that shows the chromosome, start and end position of the ethnicity estimates they provide.
When our app detects a triangulated group by performing DNA triangulation automatically, it will show the ethnicity prediction for every DNA cousin (for whom this information was available).
Now keep in mind that this is provided for both strands so you don’t know necessarily from whom you have inherited them.
Still, it’s a very helpful feature if you have diverse ancestors. We just have a new user who has Ashkenazi Jewish ancestors on one side and British/Scandinavian on the other parent. So even without parent information, this helps in this case to identify from which parent this TG is.
If you have a 23andMe DNA test try it out for free yourself.
If one or both parents has also tested at 23andMe, they phase the ethnicity map, so you do know from whom you inherited each region. 🙂
Doesn’t FTDNA do that if one or both parents have tested?
Not at the moment. Their latest white paper says “In the future, we may allow customers with linked parent-child relationships in the family tree to improve their results with trio phasing (both parents available) or duo phasing (one parent available).” (p.41)
https://blog.familytreedna.com/wp-content/uploads/2021/08/myOrigins_3_WhitePaper.pdf
Hello. I’ve become very passionate about my genealogical history ever since I’ve gotten my AncestryDNA results back in June of last year. I’ve also taken 23andme too and doing this has changed my life especially since I reconnected with my dad after 40 years when I matched his sister on AncestryDNA(I’m adopted after living in foster homes from 5 years ago). I’ve learned a lot about my family history, that I have long roots in America before the US became the US.
So I’m reading this post and I understand where you’re coming from wrt ethnicity inheritance. The thing is, I’m Black American.
I have 35% Nigeria(it was 45% when I first got my results), for example according to AncestryDNA and 38.4 Nigerian according to 23andme. If my results were judged like most people’s results are; people would think that I either have a Full Nigerian parent or at least a Full Nigerian grandparent(s); i.e recent ancestry from Nigeria.
But I don’t. I have multi generationally passed down “Nigerian” genomes from both sides of my paternal lineage and basically every ancestry inheritance that I have is Colonial roots. The African ancestry/genomes that I have are Pre Trans Atlantic Slave Trade origins(i.e Africa before The Slave Trade and Colonization) I don’t have a recent Full White American(Full European) ancestor born after The Civil War. Yet my total European genome percentage is 21-23%; the “equivalent percentage” of having a Full European(Northwest European mostly British Isles) Grandparent and I have the matches from AncestryDNA and 23andme to prove I don’t have a Full European that recent.
If AncestryDNA didn’t have additional/genetic communities which does a good job in showing the roots of Black Americans with at least Pre Civil War roots(full descendants of the 1860 Black American Population of over 4 million), I would be very confused about my results not realizing that Black Americans are their own unique ethnic community in their country.
So that’s why I think that “haggling” over how much an ethnicity a person is “supposed to have,” rather than what tests interpreting ethnicity estimates because especially when you’re from a multi generationally admixed population like Black Americans or Hispanics/Latin Americans, it doesn’t do justice wrt interpreting their genomes in how it fits in understanding their family history.
What do you think about this?
You’re absolutely right that ≈25% ethnicity from any region could be from a single grandparent or from a mix of ancestors further back on multiple lines. One way to gauge how far back your Nigerian ancestors are is to analyze the sizes of your Nigerian DNA segments. 23andMe does this for you in the “Ancestry Timeline”. It’s under Ancestry > Ancestry Overview > Ancestry Timeline. You might also appreciate the DNA Painting, which actually maps each segment based on its composition.
Thank you for replying to me. I find that looking at my 23andme DNA painting is more correct than their timeline because it shows that my genomes are multi generationally passed down. I even shown my DNA painting to someone very knowledgeable about this and he remarked that my segments are very short(including my Nigerian segments). Though my X chromosome(if you seen the 2nd video that 23andme made to explain their study on The Consequences of The Trans Atlantic Slave Trade which was their study on how The TAST affected the genomes of African descent communities in The New World so you’ll know what I mean) was 97% “Nigerian.”
One of my paternal aunts, who is also Fully Black American and also took 23andme has similarly short segments.
Black Americans as a collective are multi generationally admixed(African and Northwestern European with minimal indigenous if they have it) so I interpret my results from that perspective.
You are very wise to consider the length of the individual segments.
I think this explains my 26% Swedish even though I don’t have a Swedish grandparent. Thank you once again, Leah (and Curtis Price).
I’ve never seen this broken down so well. Thank you, Leah! This helped me so much.
You’re welcome!
Hi, thanks for sharing your results. I think both 23andme and Ancestry were accurate but Ancestry gave me a more specific breakdown as a very mixed person with indigenous DNA. It appears 23andme lacks the ability to determine where indigenous DNA originated except in some cases where the majority of the DNA is from the U.S. and Canada. I have majority Mexican indigenous DNA with small bits of Peruvian, Maya, Amazonian, and U.S. indigenous DNA.
In cases of Spanish ancestors from multiple places, Ancestry also gave me a better breakdown that I confirmed from my genealogy. It also picked up my French ancestors whereas 23andme did not. Although since the French ones are from Southern France, I can see how the DNA lines get blurred.
In terms of African DNA, it seems to be multi generationally passed down like someone above mentioned but I found that 23andme gave an accurate estimate of where I found my father’s mixed African ancestors in his genealogy timeline.
None are wildly off for me, perhaps because my background seems to be only English/ Irish/ Scottish, with a bit of German/French.
23andme – 11
MyHeritage – 388
Living DNA – 1016
Ft DNA – 1403
Ancestry – 1901
23andme was almost dead-on, and the only one that picked up my 8-9% French/German, identified strong connections to both Yorkshire and County Cork, and didn’t assign large amounts of mystery-origin Scandinavian DNA. However, they also didn’t break out my Irish and Scottish from English, which removed the estimation errors that most significantly raised the scores for others.
At the other end of the scale, Ancestry over-estimated my inheritance from Scotland and Scandinavia, under-estimated from England and Ireland, and dropped France/Germany, which it had earlier included.
Thanks for sharing!
Wow! What an awesome explanation of ethnicity estimates and why they are “not soup yet” as the Legal Genealogist has said. I will have to figure out my Dad’s expected estimate and compare it to Ancestry DNA. Thanks again!
Interesting technique.
With Ancestry I get 182
How big a number do you think represents a problem ?
That’s a good question! I’m pretty comfortable with my estimates from 23andMe and AncestryDNA. I’m concerned about the ones from Living DNA and MyHeritage. So maybe somewhere in the 2000–2500 range is where’s I’d draw the line.
> That is biologically impossible, given that my father is German and Irish.
Really, you don’t know for sure that all of your 4GGPs don’t have “French” ancestry, having immigrated from the same place that the French did, and after that, they appear to be German and Irish “natives”. Plus, there’s DNA “drift” (I’m sure there’s a correct term for it, where people end up getting more DNA from one side than the other). after so many generations.
I might not have exactly 25% from any given grandparent, but I inherited exactly half of my autosomal DNA from my father, as explained here: https://thednageek.com/dna-basics-are-you-an-equal-mix-of-mom-and-dad/
Thus, half of my genetic makeup must be a combination of his ethnic makeup, which is Irish and German. While I suppose it’s possible that all of my paternal 4GGP were of pure French extraction, ended up in Germany and Ireland where they and their descendants only married other French expats, that my German and Irish DNA matches are also really French, and the other DNA testing companies that assign me German and Irish ethnicity estimates are wrong, but I doubt it.
Also, after I wrote this post, Living DNA changed my ethnicity estimates. They basically just restored it to the previous version that had a mix of French, German, Irish, and Spanish.