
Relationship Predictor Survey
The Relationship Predictor Survey was launched in March 2023 to collect large-scale data from citizen scientists (like you!) on the accuracy of several relationship predictors. The survey collects data on known DNA matches and how well each of four different predictors does at evaluating that match.
- AncestryDNA’s built-in predictions
- The original Shared cM Tool (SCT1) at DNA Painter
- The beta Shared cM Tool (SCT2) at DNA Painter
- MyHeritage’s cM Explainertool
The first three tools make predictions based on total shared DNA and are all based on work by AncestryDNA scientists. The MyHeritage tool also considers the ages of the two people who match for more specific predictions. Their tool was tested both with and without ages.
Methods
Data Collection
Volunteers were asked to report the following information about a known match: the database used, the known relationship, whether the match was related more than once, the amount of shared DNA in centimorgans, the number of shared segments, the size of the longest segment, and (when known) the ages of the two people who matched. Volunteers were also given the opportunity to have their data automatically submitted to Blaine Bettinger’s Shared cM Project.
Data was collected in a Google Form and ported to a Google Sheet for analysis (see below). Fields were either text entry, radio buttons, or pull-down choices.
No tools were evaluated that use either number of segments or longest segment for predictions. Should such a tool become available for study, it can easily be incorporated into this analysis without having to collect new data.
For each of the predictor tools, volunteers were then asked to report (1) the top prediction and its probability, (2) the second prediction and its probability, (3) the third prediction and its probability, (4) which prediction was correct, and (5) the probability of the correct answer.
Data Curation and Validation
Known relationship was collected in a text field, so the same relationship might be reported in different ways (e.g., first cousin, 1st cousin, 1C). To facilitate analysis, all relationship names were standardized.
Entries were validated in several ways. Most data entry errors were either typos or pull-down errors and could be corrected. When an error could not be corrected with confidence, the entry was excluded from the study.
First, entries were compared to other entries with the same centimorgan value. When ages are not considered, all matches that share, say 198 cM, get the same predictions in all of the tools, making it relatively easy to spot typos in a list sorted by shared centimorgans.
As the number of entries increased, it became possible to auto-fill many of the predictions, because those centimorgan values had already been reported by another volunteer. This allowed us to streamline the data entry form for some predictor tools to ask only which prediction was correct and that prediction’s probability.
Predictions were validated using the filter feature of Google Sheets. For example, to check predictions for first cousins, the relationship column was filtered to only show “1C”, then the first, second, and third predictions were filtered in turn to ensure that the volunteer had correctly evaluated the prediction.
An Overview of the Data
To date, the survey has collected more than 6,100 responses from more than 275 unique volunteers and representing 52 different relationships. The closest relationship was parent–child and the most distant was 8th cousin twice removed (8C2R).
The tables below summarize the data by centimorgan range and source.

The reported matches were distributed nicely across the centimorgan spectrum, with the highest number of reports (1,591) between 90 and 340 cM. This is not unexpected, as this range is both plentiful in matches and close enough that the relationships are still somewhat easy to document.
The vast majority of reports–5,253 of 6,149 total–were for matches at AncestryDNA. Again, not surprising. AncestryDNA has the largest DNA database by far and excellent tools, like SideView and ThruLines, to help find connections to our DNA matches.
Of the 6,149 contributions, 4,042 reported no known endogamy, 2,015 claimed endogamy, and 92 indicated a double relationship. Endogamy and double-relationships can affect relationship prediction by augmenting the amount of shared DNA, so those samples were analyzed separately.
Ages or approximate ages were available for 2,559 and 284 entries, respectively, allowing for 2,832 data points using the full power of MyHeritage’s cM Explainer. All 6,149 entries were also tested using cM Explainer without ages.
Evaluating the Tools
The three Ancestry-based (AncestryDNA’s built-in probabilities and the two versions of the Shared cM Tool at DNA Painter) predict groups of genetically equivalent relationships (e.g., grandparent–grandchild, aunt/uncle–niece/nephew or nibling, and half-sibling) rather than individual relationships. MyHeritage’s cM Explainer, by contrast, uses the ages of the two matches to distinguish among the genetically-equivalent options. Thus, the latter tool cannot be compared directly to the former three. Instead, the first three tools were all compared to one another, and cM Explainer was tested with and without age information to gauge the effect.
Each tool was evaluated using three criteria: (1) how frequently the top prediction included the correct relationship (more frequently is better), (2) the average probability given to the correct relationship (higher is better), and (3) how frequently the correct relationship was not predicted at all (ideally, this won’t happen and can be considered a “cardinal sin” of relationship prediction).
Only matches with no reported endogamy are analyzed here.
Predictions Based on Centimorgan Amount
Executive Summary: For non-endogamous matches, the built-in predictions at AncestryDNA perform slightly better overall than either of the Shared cM Tool (SCT) versions, and the SCT beta probabilities (SCT2) are somewhat better than the original probabilities (SCT1).
All three of the Ancestry-based tools did extremely well at predicting parent–child and full sibling relationships, suggesting the correct relationship as the first option (“Right 1st Time” in the tables below) all or most of the time at high probability and almost always including the correct relationship as an option. The only “exception” was a full-sibling match from 23andMe at 3,427 cM (in red in the table below). 23andMe tallies sibling matches differently from the other companies by counting fully-identical regions twice. Both SCT versions warn the user of this possibility, although the warning could be made more noticeable.
Similarly, all three tools predicted Group 2 relationships (as defined by the Shared cM Project) as the first prediction 95% of the time or more and at an average probability of 95% or more. This group includes grandparent–grandchild, nibling, and half-sibling. The only cardinal sin was an aunt who was predicted as a parent because she was the identical twin of the tester’s mother.

For Group 3 (1C, etc.) and Group 4 (1C1R, etc.), all three tools did well, with marginal improvements for AncestryDNA over SCT2 over SCT1 for most metrics and most relationships.

This trend continued for more distant relationships, as shown below. Broadly speaking, AncestryDNA’s built-in predictions were slightly more likely to list the correct relationship first and to give that relationship a slightly higher probability.

Predictions Based on Centimorgan Amount Plus Age
Executive Summary: MyHeritage’s cM Explainercan help to distinguish among genetically-equivalent relationships that are close, but it is increasingly likely to commit “cardinal sins” as relationships become more distant and as relationships are more removed in generations. It should be used with caution until further refinements are implemented.
The MyHeritage tool performed quite well for immediate family matches. As expected, using ages allowed it to distinguish between a parent and a child. With ages, the tool also correctly predict the 3,427-cM sibling match from 23andMe (described above), whereas without ages the match was incorrectly predicted to be a parent. Unlike the SCT versions, cM Explainer does not warn the user that siblings tested at 23andMe can give misleading results.

Using ages drastically improved the predictions for grandparent–grandchild matches as well as the probabilities for niblings and half-siblings. Like the Ancestry-based tools, cM Explainer failed to predict the identical-twin aunt as a parent. Without ages, it also failed to predict a nibling who shared only 1,202 cM. Unlike the other tools, cM Explainer also failed to predict two half siblings, one when ages weren’t used and another when ages were used.

The cM Explainer tools gave mixed results for Group 3 and Group 4. Using ages improved the average probability for all relationships, but most included “cardinal sins” where the correct relationship was not listed at all. Note that some relationships, like great-grandnibling, had few submissions
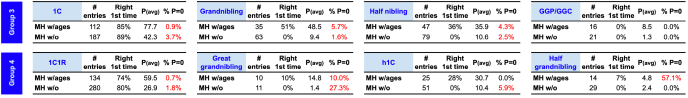
The pattern persisted for more distant relationships. Using ages improved the predictions, for the most part, but there were high cardinal sin rates, in which the correct relationship was not listed at all. This was especially true of removed relationships.

Conclusions
The three AncestryDNA-based tools predict relationship groups, while MyHeritage’s cM Explainer aspires to use ages to predict specific relationships. That aspiration has great potential, but the current implementation has weaknesses. Specifically, cM Explainer often fails to list the correct option entirely, especially for more distant matches and for removed relationships. This “cardinal sin” of prediction can actively mislead the user and cause more sophisticated tools, like What Are the Odds (WATO), to rule out the real relationship. MyHeritage is expected to continue to improve their tool over time and have released one update.
The SCT1, SCT2, and built-in AncestryDNA predictions derive from data released, respectively, in 2016, ≈2019, and more recently. These predictions have gotten progressively better over time. The original probabilities were based solely on computer-generated data. Presumably, AncestryDNA’s scientists have since been refining their computer models using empirical data from their customers.
Analyzing multiple DNA matches at once in a tree-based framework, as WATO does, is a far more powerful approach than simple one-to-one relationship predictions, and even minor improvements can have substantial effects when multiplied over several matches. For that reason, I now recommend the beta version of WATO (which uses the same probabilities as SCT2) over the original one (which uses SCT1 probabilities).
While shared centimorgans have the greatest predictive power for DNA-based relationships, other factors–like age, number of segments, and longest segment–have promise to deliver marginal improvements. Should additional predictive tools become available for this study, can can easily be included using the match data already collected.
No end date is planned for this study. More data can improve the analyses summarized in this post. Should you like to submit your DNA matches to known relatives, feel free to do so at this link.

Updates to This Post
- 20 Jun 2023 – Clarified the meaning of “Right 1st Time” and corrected typos


Thank you for all the work you do. Interesting update.
Does SegcM fit into one of your categories of prediction tools? It uses number of segments, at least for very close matches.
The developer of SegcM felt very strongly that his tool *not* be included in this study, so we respected his wishes.
I notice you limited your summary to non-endogamous relationships. Were there similar results for endogamous relationships?
There weren’t as many endogamous samples, so I focused on non-endogamous for now.
Makes sense. I just wonder how helpful any of these are with endogamous relationships.